Optimal Designs for Phase II/III Drug Development Programs with several Phase III Trials
Further reading: Preussler, S., Kieser, M., and Kirchner, M. (2019). Optimal sample size allocation and go/no-go decision rules for phase II/III programs where several phase III trials are performed. Biometrical Journal, 61(2), 357-378.
Summary
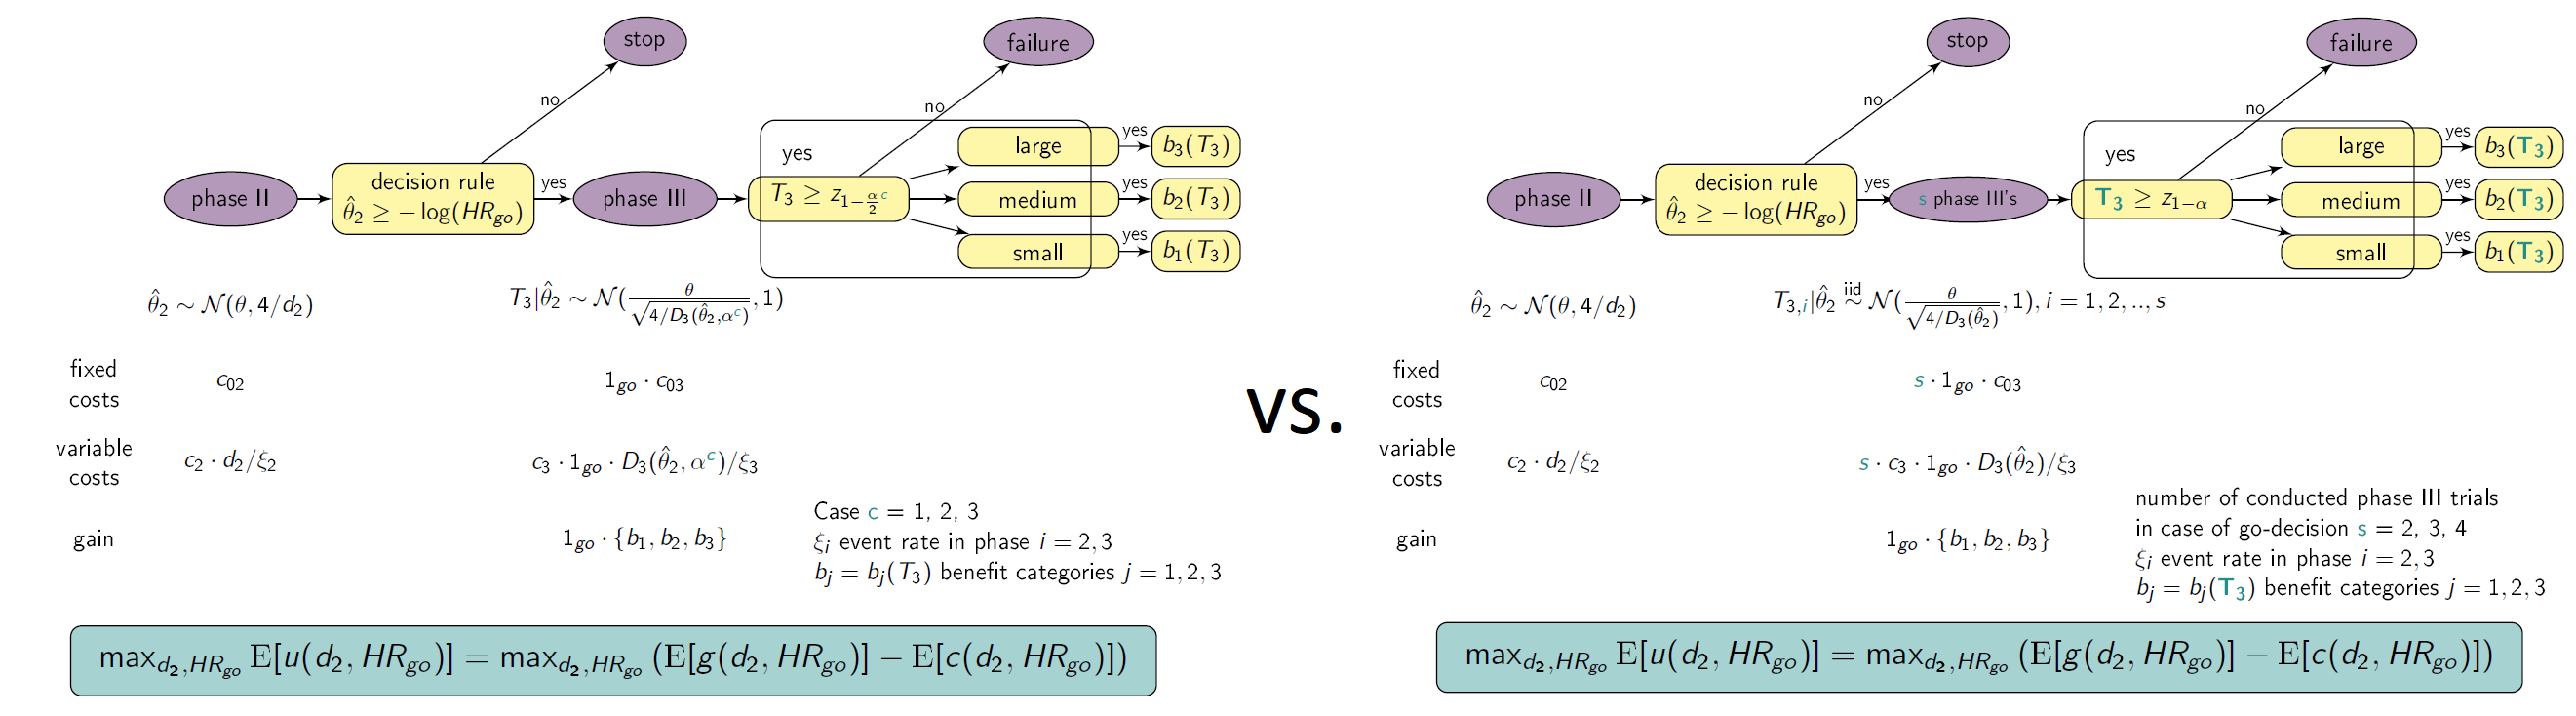
This shiny App is a tool for phase II/III drug development planning aiming to optimize the sample size allocation and go/no-go decision rule with respect to the maximal expected utility. The approach is based on a utility function taking into account, e.g., fixed and variable costs of the program (c02, c03, c2 , c3), expected benefits after successful market launch (b1, b2, b3), assumed true hazard rate (HR), and event rates in phase II and III (ξi, i=2,3). The considered drug development program consists of one phase II trial possibly followed (in case of a go-decision after phase II) by one, two, three or four phase III trials (depending on Strategy) of which at least one, two or three phase III trials need to be significant (depending on Case). In particular, the considered cases and compared strategies are
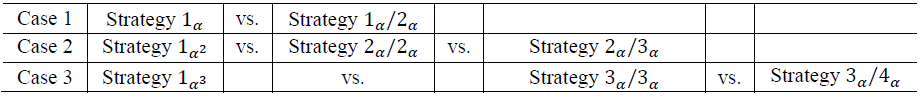
For the detailed definition of the cases and strategies see Preussler et. al (2019). The graphic below illustrates the framework. In Case 2 for example, two significant trials are needed for approval (“two-trial efficacy criterion”, US FDA (1995)). Here, Strategy 1α2 (one large trial with significance level α2 may serve evidence on effectiveness instead of two trials, e.g. Fisher (1999)) is compared with Strategy 2α/2α and Strategy 2α/3α, where two and three trials are performed in case of a go decision, respectively. Therefore, two and three times the costs for phase III apply, respectively. For the definitions of program success and the effect size categories, the reader may be referred to Preussler et. al (2019) again.
Instructions
- Choose the number of significant trials needed for approval (one, two, three i.e. Case 1, 2 or 3).
- Select the range of d2 and HRgo over which the optimization is performed.
- Specify all other drug development program parameters.
- Choose if the table of the results should be refreshed (do not show previous results) or not (also shows previous results).
- Choose if a plot of the optimization region should be plotted.
- Click on “Go” and wait until results are presented in the table below.
Values presented in table
- Strategy and Case
- expected utility (u)
- assumed true hazard rate (HR)
- threshold value for the decision rule to go to phase III (HRgo)
- total number of events for phase II (d2)
- total expected number of events for all phase III trials (d3)
- total expected number of events in the program (d)
- total sample size for phase II (n2)
- total expected sample size for one phase III (n3)
- total expected sample size in the program (n)
- probability to go to phase III (pgo)
- probability of a successful program (sProg)
- probability of a successful program with small effect (sProg1)
- probability of a successful program with medium effect (sProg2)
- probability of a successful program with large effect (sProg3)
- costs for phase II (K2)
- costs for phase III (K3)
and further input parameters.
References
FDA guidance for industry: providing clinical evidence of effectiveness for human drug and biological products, 1998. Available at: www.fda.gov/downloads/drugs/guidancecomplianceregulatoryinformation/guidances/ucm072008.pdf (accessed last 21.05.2019).
Fisher, L. D. (1999). One large, well-designed, multicenter study as an alternative to the usual FDA paradigm. Drug Information Journal 33, 265-271.
Preussler, S., Kieser, M., and Kirchner, M. (2019). Optimal sample size allocation and go/no-go decision rules for phase II/III programs where several phase III trials are performed. Biometrical Journal, 61(2), 357-378.
Further Software
The software drugdevelopR (available via: https://web.imbi.uni-heidelberg.de/drugdevelopR/) includes further Apps and an R package for optimal phase II/III drug development planning. The Code, detailed user manuals and application examples can be found on Github (https://github.com/Sterniii3/drugdevelopR).
Note
If the server is busy, you may need to double click the “Go”-button in order to see the updated plot.
Maintainer
Stella Erdmann, Institute of Medical Biometry, University of Heidelberg, email: erdmann@imbi.uni-heidelberg.de.
Version 1.0