Optimal Designs for Phase II/III Drug Development Programs - Time-to-event Endpoints
Further reading: Kirchner, M., Kieser, M., Goette, H., & Schueler, A. (2016). Utility-based optimization of phase II/III programs. Statistics in Medicine, 35(2), 305-316.
Summary
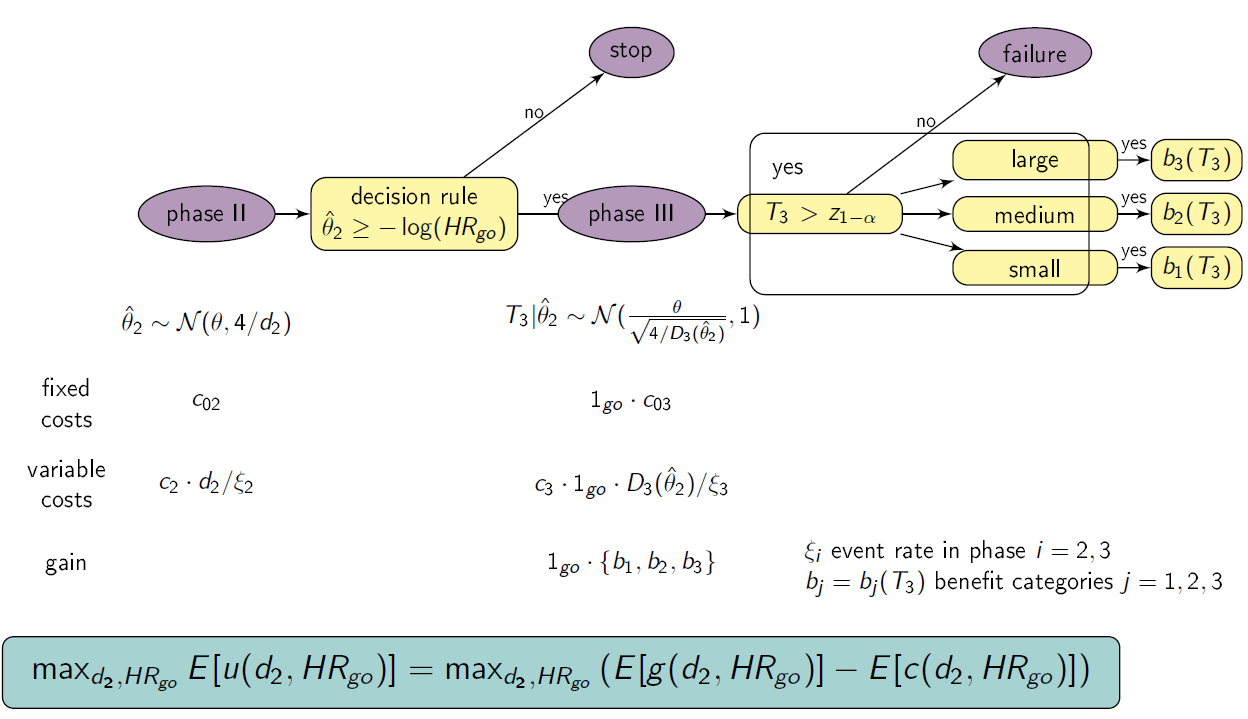
This shiny App is a tool for phase II/III drug development planning aiming to optimize the sample size allocation and go/no-go decision rule with respect to the maximal expected utility. The approach is based on a utility function taking into account, e.g., fixed and variable costs of the program (c02, c03, c2 , c3), expected benefits after successful market launch (b1, b2, b3 with respect to the treatment effect size observed in phase III), assumed true hazard rate (HR), and event rates in phase II and III (ξ2, ξ3) (Kirchner et. al, 2016). It gives insights on how optimal design parameters (e.g. sample size for phase II and III (n2=d2/ξ2, n3=d3/ξ2; di number of events in phase i=2,3), threshold value for the go/no-go decision rule HRgo) and program characteristics (e.g. maximal expected utility, probability to go to phase III, probability of a successful program) change with for example varying expected benefit and assumptions about the true treatment effect (θ=-log(HR)).
Setting
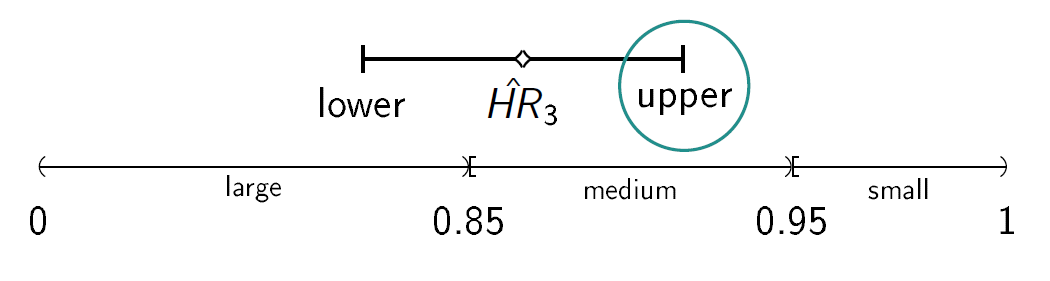
We consider a drug development program with one exploratory phase II and one confirmatory phase III trial, which are performed independently with the same time-to-event primary endpoint and the same population. The phase II trial is a two-arm randomized trial followed by a decision rule, whether or not a phase III trial (RCT) is conducted. Program success is the joint event of going to phase III and declaring the treatment significant superior to the control. The treatment effect is measured by θ=-log(HR), where HR is the true hazard ratio, i.e., the ratio between the hazard function for the experimental treatment and the control group. We require that only promising treatments lead to a phase III trial: if the treatment effect estimate of phase II θ̂2 overshoots a predefined threshold value -log(HRgo), the treatment is declared to be promising. In case of a go decision, the calculation of the number of events for phase III is based on the promising treatment effect estimate of phase II by the Schoenfeld (1981) formula and the log-rank test is performed, which controls the type-I error by α and aims at 1- β power (calculation of the number of events for phase III and testing is done one-siged, e.g. with level α/2). To compute the variable per-patient costs, the sample size is calculated by dividing the (expected) number of events by the event rate, i.e. ni = di/ξi, i=2,3, and n2 and n3 are rounded up to the next equal natural number. In case of program success, we assume that the amount of benefit depends on the value of the observed treatment effect in phase III. Orientated on a report of the German Institute for Quality and Efficiency in Health products, three effect size categories (small, medium, large) and associated benefit categories (b1, b2, b3) are defined by threshold values (1, 0.95, 0.85) which have to be undershoot by the upper boundary of the two sided (1-α)-confidence interval of the HR in phase III (IQWiG, 2016):
Furthermore, a constraint on the total costs of the drug development program can be specified (K).
Instructions
- Select the range of d2 and HRgo over which the optimization is performed.
- Specify all other drug development program parameters.
- Choose if the table of the results should be refreshed (do not show previous results) or not (also shows previous results).
- Choose if a plot of the optimization region should be plotted.
- Click on “Go” and wait until results are presented in the table below.
Optimal Designs for Phase II/III Drug Development Programs - Binary Endpoints
Summary
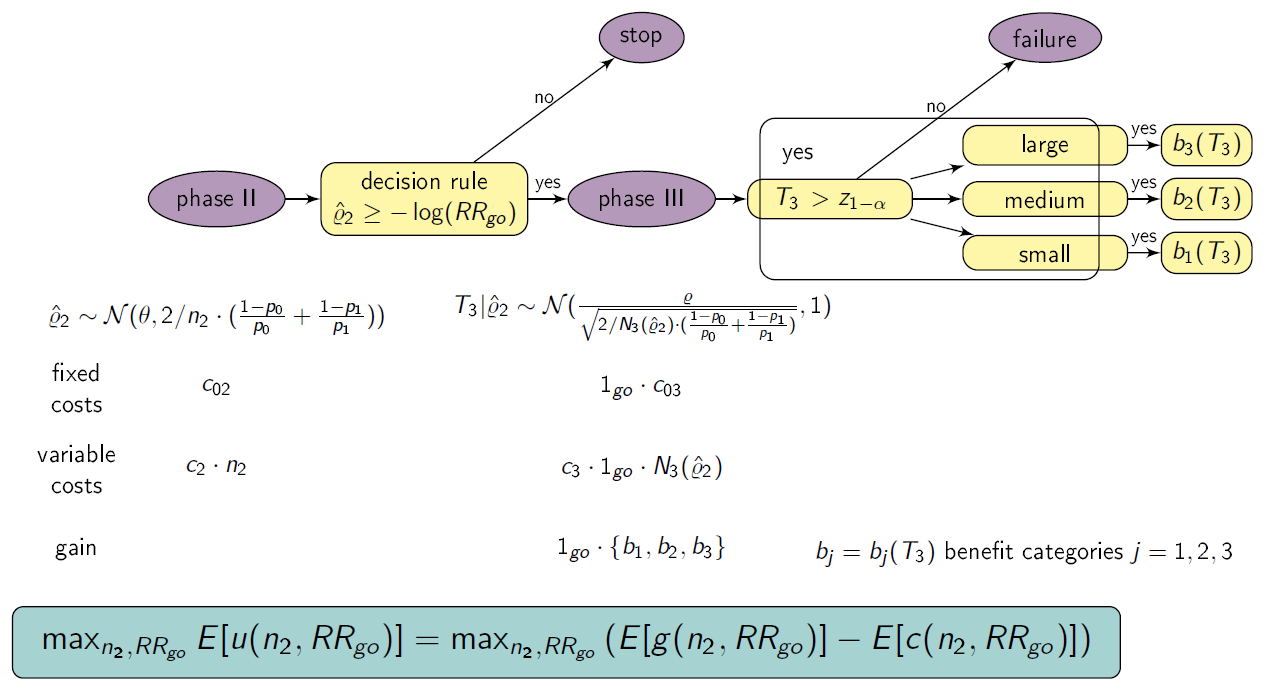
This shiny App is a tool for phase II/III drug development planning aiming to optimize the sample size allocation and go/no-go decision rule with respect to the maximal expected utility. The approach is based on a utility function taking into account, e.g., fixed and variable costs of the program (c02, c03, c2 , c3), expected benefits after successful market launch (b1, b2, b3 with respect to the treatment effect size observed in phase III) and assumed true risk ratio (RR). It gives insights on how optimal design parameters (e.g. sample size for phase II and III (n2, n3), threshold value for the go/no-go decision rule RRgo) and program characteristics (e.g. maximal expected utility, probability to go to phase III, probability of a successful program) change with for example varying expected benefit and assumptions about the true treatment effect (ρ=-log(RR)).
Setting
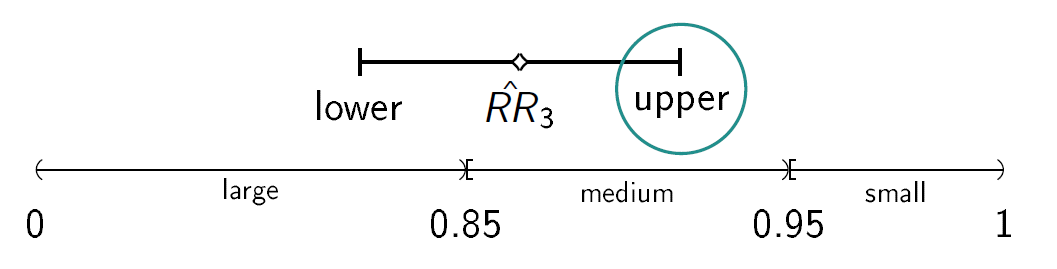
We consider a drug development program with one exploratory phase II and one confirmatory phase III trial, which are performed independently with the same binary primary endpoint and the same population. The phase II trial is a two-arm randomized trial followed by a decision rule, whether or not a phase III trial (RCT) is conducted. Program success is the joint event of going to phase III and declaring the treatment significant superior to the control. The treatment effect is measured by ρ=-log(RR), where RR is the risk ratio, i.e., the ratio between the rate for the experimental treatment and the control group. We require that only promising treatments lead to a phase III trial: if the treatment effect estimate of phase II ρ̂2 overshoots a predefined threshold value -log(RRgo), the treatment is declared to be promising. In case of a go decision, the calculation of the sample size for phase III is based on the promising treatment effect estimate of phase II with significance level α and 1- β power. In case of program success, we assume that the amount of benefit depends on the value of the observed treatment effect in phase III. Orientated on a report of the German Institute for Quality and Efficiency in Health products, three effect size categories (small, medium, large) and associated benefit categories (b1, b2, b3) are defined by threshold values (1, 0.95, 0.85) which have to be undershoot by the upper boundary of the two sided (1-α)-confidence interval of the RR in phase III (IQWiG, 2016):
Furthermore, a constraint on the total costs of the drug development program can be specified (K).
Instructions
- Select the range of n2 and RRgo over which the optimization is performed.
- Specify all other drug development program parameters.
- Choose if the table of the results should be refreshed (do not show previous results) or not (also shows previous results).
- Choose if a plot of the optimization region should be plotted.
- Click on “Go” and wait until results are presented in the table below.
Optimal Designs for Phase II/III Drug Development Programs - Normally Distributed Endpoints
Summary
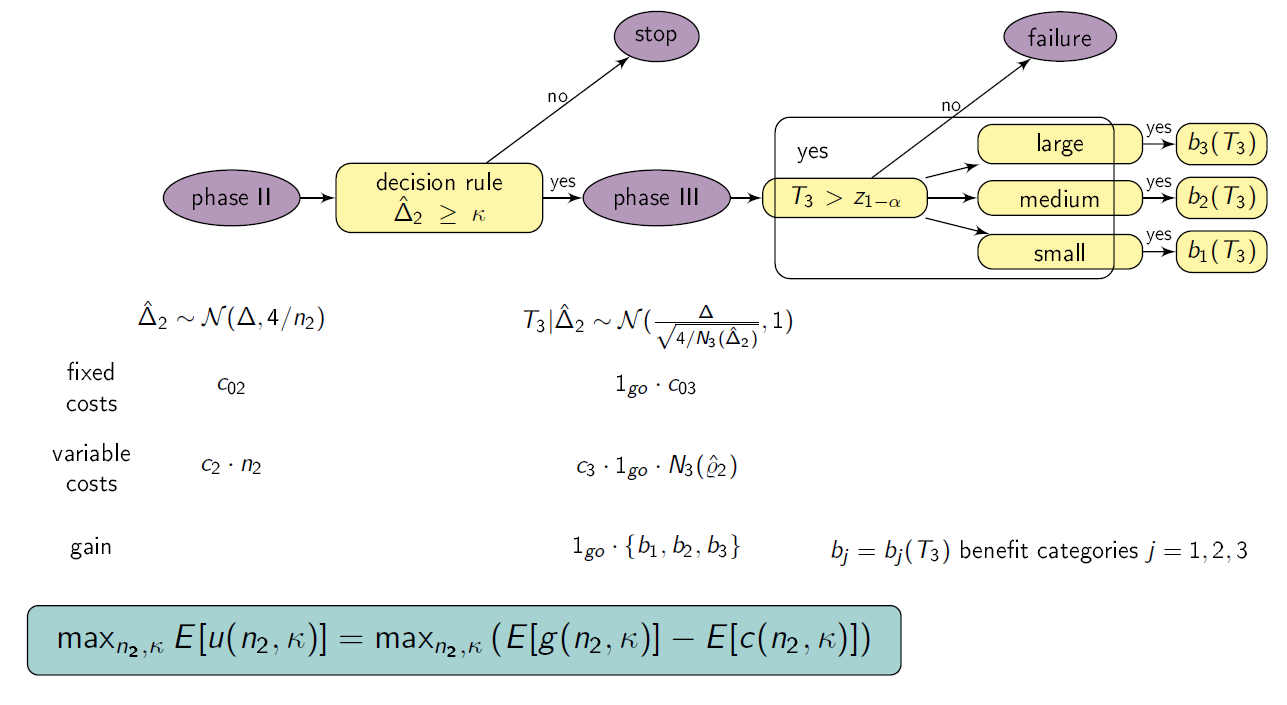
This shiny App is a tool for phase II/III drug development planning aiming to optimize the sample size allocation and go/no-go decision rule with respect to the maximal expected utility. The approach is based on a utility function taking into account, e.g., fixed and variable costs of the program (c02, c03, c2 , c3), expected benefits after successful market launch (b1, b2, b3 with respect to the treatment effect size observed in phase III) and assumed true standardized difference in means (Δ). It gives insights on how optimal design parameters (e.g. sample size for phase II and III (n2, n3), threshold value for the go/no-go decision rule κ) and program characteristics (e.g. maximal expected utility, probability to go to phase III, probability of a successful program) change with for example varying expected benefit and assumptions about the true treatment effect Δ.
Setting
We consider a drug development program with one exploratory phase II and one confirmatory phase III trial, which are performed independently with the same normally distributed primary endpoint and the same population. The phase II trial is a two-arm randomized trial followed by a decision rule, whether or not a phase III trial (RCT) is conducted. Program success is the joint event of going to phase III and declaring the treatment significant superior to the control. The treatment effect is measured by the standardized difference in means Δ. We require that only promising treatments lead to a phase III trial: if the treatment effect estimate of phase II Δ̂2 overshoots a predefined threshold value κ, the treatment is declared to be promising. In case of a go decision, the calculation of the sample size for phase III is based on the promising treatment effect estimate of phase II and the z test is performed, which controls the type-I error by α and aims at 1- β power. In case of program success, we assume that the amount of benefit depends on the value of the observed treatment effect in phase III. Orientated on a report of the German Institute for Quality and Efficiency in Health products (IQWiG, 2016), three effect size categories (small, medium, large) and associated benefit categories (b1, b2, b3) are defined by threshold values (e.g. 0, 0.5, 0.8 as proposed by Cohen (1988)) which have to be overshoot by the lower boundary of the two sided (1-α)-confidence interval of the standardized difference in means in phase III:
Furthermore, a constraint on the total costs of the drug development program can be specified (K).
Instructions
- Select the range of n2 and κ over which the optimization is performed.
- Specify all other drug development program parameters.
- Choose if the table of the results should be refreshed (do not show previous results) or not (also shows previous results).
- Choose if a plot of the optimization region should be plotted.
- Click on “Go” and wait until results are presented in the table below.
Values presented in table
- expected utility (u)
- assumed true hazard rate (HR)
- threshold value for the decision rule to go to phase III (HRgo)
- total number of events for phase II (d2)
- total expected number of events for phase III (d3)
- total expected number of events in the program (d)
- total sample size for phase II (n2, rounded to the next equal natural number)
- total expected sample size for phase III (n3, rounded to the next equal natural number)
- total expected sample size in the program (n = n2 + n3)
- maximal costs of the program (K)
- probability to go to phase III (pgo)
- probability of a successful program (sProg)
- probability of a successful program with small treatment effect in Phase III (sProg1)
- probability of a successful program with medium treatment effect in Phase III (sProg2)
- probability of a successful program with large treatment effect in Phase III (sProg3)
- expected costs for phase II (K2)
- expected costs for phase III (K3)
and further input parameters.
References
Kirchner, M., Kieser, M., Goette, H., & Schueler, A. (2016). Utility-based optimization of phase II/III programs. Statistics in Medicine, 35(2), 305-316.
IQWiG (2016). Allgemeine Methoden. Version 5.0, 10.07.2016, Technical Report. Available at https://www.iqwig.de/de/methoden/methodenpapier.3020.html, assessed last 15.05.19.
Schoenfeld, D. (1981). The asymptotic properties of nonparametric tests for comparing survival distributions. Biometrika, 68(1), 316-319.
Additional Features
The true underlying treatment effect θ can also be modelled by a prior distribution (https://web.imbi.uni-heidelberg.de/prior/). Optimal planning can then be done with the function optimal_tte() of the R package drugdevelopR available at: https://github.com/Sterniii3/drugdevelopR.
Note
If the server is busy, you may need to double click the “Go”-button in order to see the updated plot.
Maintainer
Stella Erdmann, Institute of Medical Biometry, University of Heidelberg, email: erdmann@imbi.uni-heidelberg.de.
Beta version 0.5
Values presented in table
- expected utility (u)
- assumed true rate for control group (P0)
- assumed true rate for treatment group (P1)
- assumed true risk ratio (RR=P1/P0)
- threshold value for the decision rule to go to phase III (RRgo)
- total sample size for phase II (n2)
- total expected sample size for phase III (n3, rounded to the next equal natural number)
- total expected sample size in the program (n = n2 + n3)
- maximal costs of the program (K)
- probability to go to phase III (pgo)
- probability of a successful program (sProg)
- probability of a successful program with small treatment effect in Phase III (sProg1)
- probability of a successful program with medium treatment effect in Phase III (sProg2)
- probability of a successful program with large treatment effect in Phase III (sProg3)
- expected costs for phase II (K2)
- expected costs for phase III (K3)
and further input parameters.
References
IQWiG (2016). Allgemeine Methoden. Version 5.0, 10.07.2016, Technical Report. Available at https://www.iqwig.de/de/methoden/methodenpapier.3020.html, assessed last 15.05.19.
Additional Features
The true underlying risk ratio RR can also be modelled by assuming a prior distribution (https://web.imbi.uni-heidelberg.de/prior/). Optimal planning can then be done with the function optimal_binary() of the R package drugdevelopR available at: https://github.com/Sterniii3/drugdevelopR.
Note
If the server is busy, you may need to double click the “Go”-button in order to see the updated plot.
Maintainer
Stella Erdmann, Institute of Medical Biometry, University of Heidelberg, email: erdmann@imbi.uni-heidelberg.de.
Beta version 0.5
Values presented in table
- expected utility (u)
- assumed true standardized difference in means (Δ)
- threshold value for the decision rule to go to phase III (κ)
- total sample size for phase II (n2)
- total expected sample size for phase III (n3, rounded to the next equal natural number)
- total expected sample size in the program (n = n2 + n3)
- maximal costs of the program (K)
- probability to go to phase III (pgo)
- probability of a successful program (sProg)
- probability of a successful program with small treatment effect in Phase III (sProg1)
- probability of a successful program with medium treatment effect in Phase III (sProg2)
- probability of a successful program with large treatment effect in Phase III (sProg3)
- expected costs for phase II (K2)
- expected costs for phase III (K3)
and further input parameters.
References
Cohen, J. (1988). Statistical power analysis for the behavioral sciences.
IQWiG (2016). Allgemeine Methoden. Version 5.0, 10.07.2016, Technical Report. Available at https://www.iqwig.de/de/methoden/methodenpapier.3020.html, assessed last 15.05.19.
Additional Features
The true underlying standardized difference in means can also be modelled by assuming a prior distribution (https://web.imbi.uni-heidelberg.de/prior/). Optimal planning can then be done with the function optimal_normal() of the R package drugdevelopR available at: https://github.com/Sterniii3/drugdevelopR.
Note
If the server is busy, you may need to double click the “Go”-button in order to see the updated plot.
Maintainer
Stella Erdmann, Institute of Medical Biometry, University of Heidelberg, email: erdmann@imbi.uni-heidelberg.de.
Version 1.0